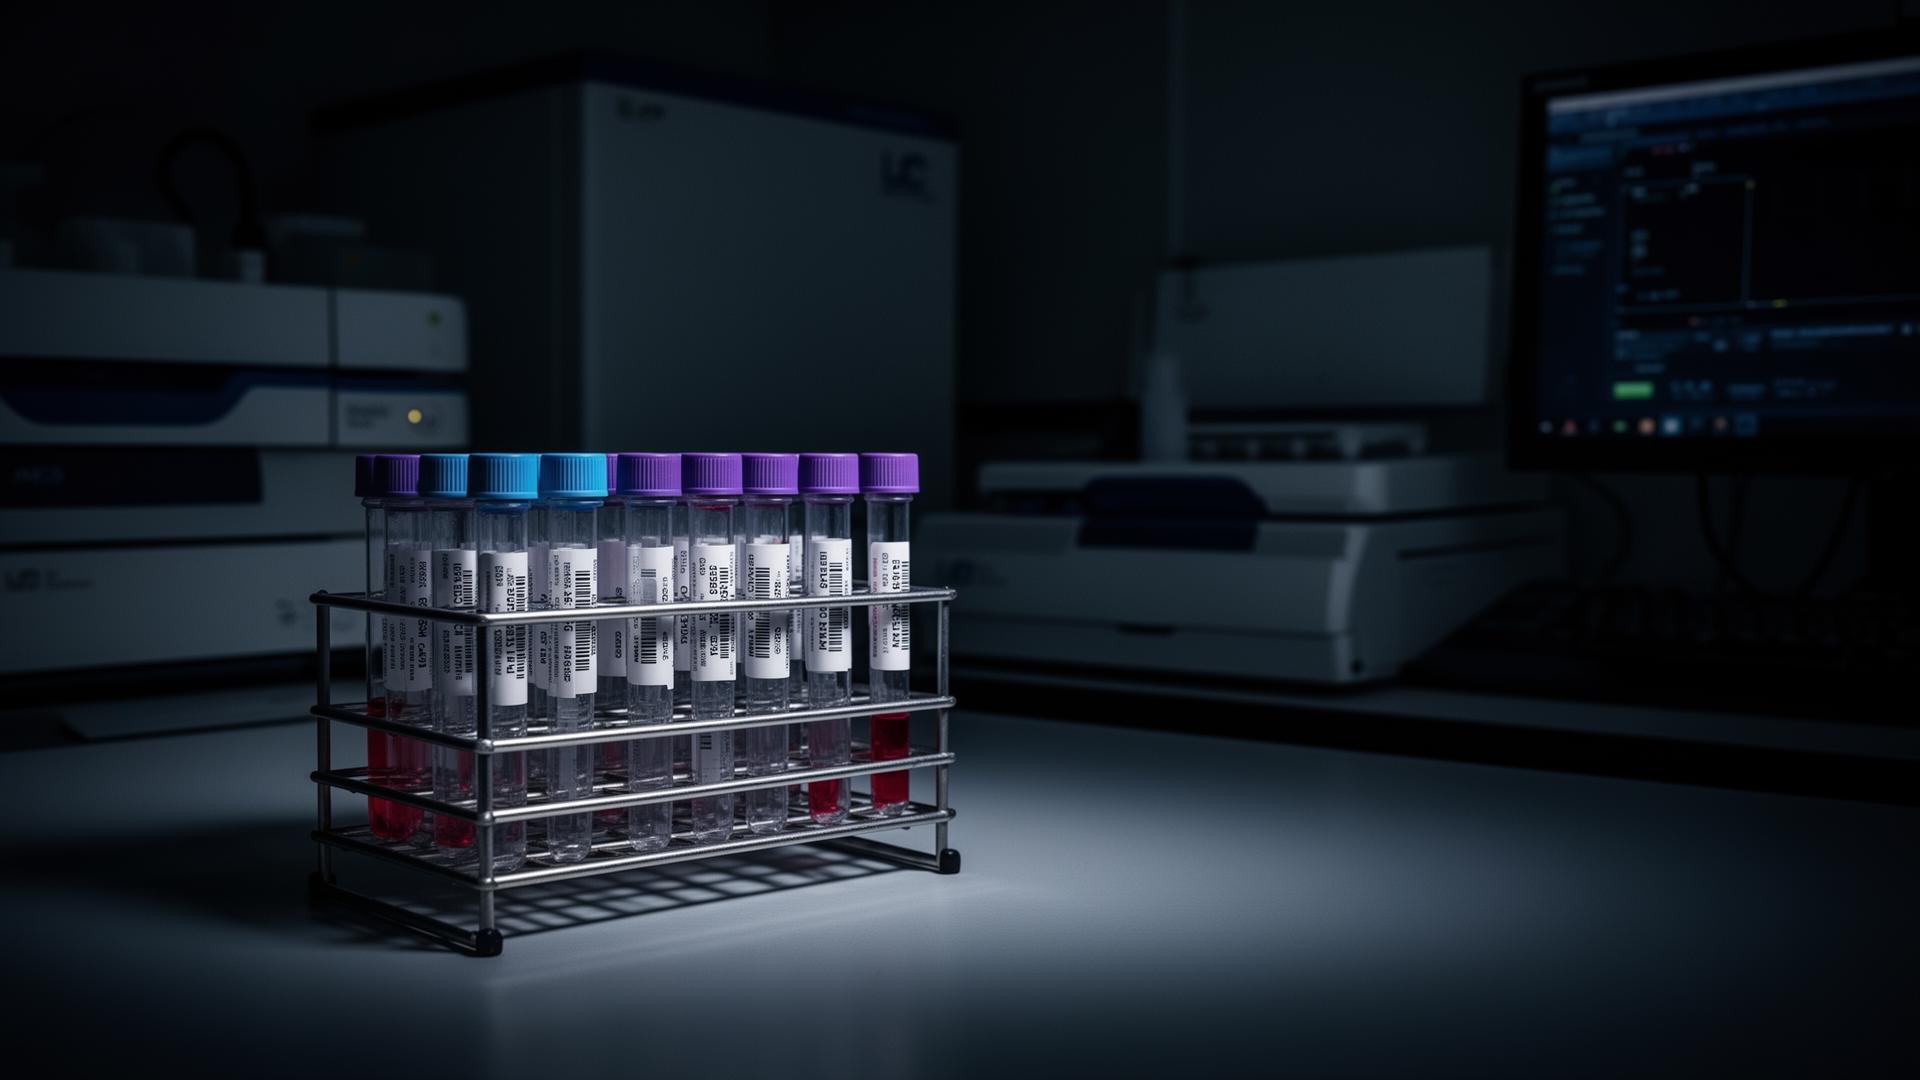
40-Analyte Mycotoxin Panel
Report #26013197 | Hayes Microbial Consulting, LLC | EPA Lab ID: VA01419 | Collected March 14, 2026 | LC-MS/MS Method HMC #MS-501
Roquefortine C
193 pg | 30.0 pg/cm²
Produced by: Penicillium
Neurotoxin capable of tremors at high doses. Detection at this level indicates Penicillium activity. Source investigation recommended.
Beauvericin
<LOQ
Produced by: Beauveria, Fusarium
Ionophoric mycotoxin, disrupts cell membrane ion transport. Trace detection warrants monitoring.
Sterigmatocystin
<LOQ
Produced by: Aspergillus versicolor, A. nidulans, A. sydowii
Polyketide — hepatotoxic and carcinogenic. Structurally related to Aflatoxin B1. Any detection warrants identification of Aspergillus growth sources.
37 of 40 analytes tested below limit of detection, including Aflatoxin B1, Ochratoxin A, Satratoxin G/H, T-2 Toxin, Gliotoxin, and Zearalenone.
| Mycotoxin | LOD Limit | Surface Density | Result |
|---|---|---|---|
| 3-Acetyldeoxynivalenol | <50.0 pg | <7.75 pg/cm² | <LOD |
| 4-Deoxynivalenol | <50.0 pg | <7.75 pg/cm² | <LOD |
| 15-Acetyldeoxynivalenol | <100.0 pg | <15.5 pg/cm² | <LOD |
| Aflatoxin B1 | <50.0 pg | <7.75 pg/cm² | <LOD |
| Aflatoxin B2 | <25.0 pg | <3.88 pg/cm² | <LOD |
| Aflatoxin G1 | <25.0 pg | <3.88 pg/cm² | <LOD |
| Aflatoxin G2 | <50.0 pg | <7.75 pg/cm² | <LOD |
| Aflatoxin M1 | <25.0 pg | <3.88 pg/cm² | <LOD |
| Aflatoxin M2 | <25.0 pg | <3.88 pg/cm² | <LOD |
| Alternariol | <2.50 ng | <388 pg/cm² | <LOD |
| Beauvericin | <150 pg | <23.3 pg/cm² | TRACE |
| Chaetoglobosin A | <250 pg | <38.8 pg/cm² | <LOD |
| Citrinin | <800 pg | <124 pg/cm² | <LOD |
| Diacetoxyscirpenol | <50.0 pg | <7.75 pg/cm² | <LOD |
| Enniatin B | <50.0 pg | <7.75 pg/cm² | <LOD |
| Fumitremorgin B | <50.0 pg | <7.75 pg/cm² | <LOD |
| Fumitremorgin C | <50.0 pg | <7.75 pg/cm² | <LOD |
| Fumonisin B1 | <12.5 ng | <1.94 ng/cm² | <LOD |
| Fumonisin B2 | <5.00 ng | <775 pg/cm² | <LOD |
| Fumonisin B3 | <2.50 ng | <388 pg/cm² | <LOD |
| Fusarenone X | <100.0 pg | <15.5 pg/cm² | <LOD |
| Gliotoxin | <25.0 ng | <3.88 ng/cm² | <LOD |
| HT-2 Toxin | <50.0 pg | <7.75 pg/cm² | <LOD |
| Mycophenolic Acid | <50.0 pg | <7.75 pg/cm² | <LOD |
| Neosolaniol | <50.0 pg | <7.75 pg/cm² | <LOD |
| Ochratoxin A | <50.0 pg | <7.75 pg/cm² | <LOD |
| Penicillic Acid | <75.0 pg | <11.6 pg/cm² | <LOD |
| Penitrem A | <50.0 pg | <7.75 pg/cm² | <LOD |
| Roquefortine C | — | — | DETECT193 pg / 30.0 pg/cm² |
| Roridin E | <100.0 pg | <15.5 pg/cm² | <LOD |
| Rugulosin | <400 pg | <62.0 pg/cm² | <LOD |
| Satratoxin G | <50.0 pg | <7.75 pg/cm² | <LOD |
| Satratoxin H | <50.0 pg | <7.75 pg/cm² | <LOD |
| Stachybotrylactam | <50.0 pg | <7.75 pg/cm² | <LOD |
| Sterigmatocystin | <150 pg | <23.3 pg/cm² | TRACE |
| T-2 Toxin | <50.0 pg | <7.75 pg/cm² | <LOD |
| Verrucarin A | <50.0 pg | <7.75 pg/cm² | <LOD |
| Verruculogen | <50.0 pg | <7.75 pg/cm² | <LOD |
| Viridicatumtoxin | <2.50 ng | <388 pg/cm² | <LOD |
| Zearalenone | <5.00 ng | <775 pg/cm² | <LOD |
- 01
Compare which analytes were detected vs. below LOD relative to this reference.
- 02
Pay particular attention to Stachybotrys markers: Satratoxin G/H, Stachybotrylactam, Roridin E, Verrucarin A.
- 03
Compare surface density values (pg/cm²) for any detected compounds against these limits.
- 04
Multiple detections in combination, even at sub-quantification levels, may indicate more significant contamination than any single result suggests.
- 05
A clean panel does not guarantee zero exposure — sampling location, surface type, and timing all affect results.
Have your lab results? We can help you interpret them.
Talk to an Expert